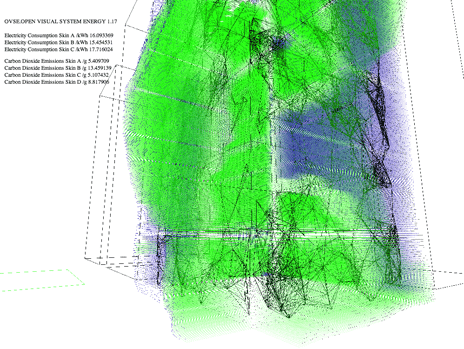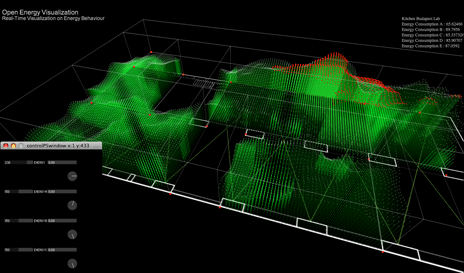
Image Open Energy. Real-Time Energy Behaviour Visualization. Fran Castillo.
Internet of Cities. City Data Sensing. Real-Time City.
We are currently engaged in exploring new models of dynamic cities. In parallel to the evolution of the model “Internet of Things”, in which the micro computation is embedded in the design of objects, the model Internet of Cities is emerging: it consists in multiple interconnected layers – energy, mobility, information – as an example of one of its layers, the Internet of Energy. It proposes a new model of distributed generation and energy management based on info-energetic infrastructure. In the model, Internet of Cities, the computation is distributed in urban infrastructure, the deployment of sensing technology allows the monitoring of different urban, environmental, energy parameters. This technology produces a large amount of data (Big Data). The exploration and analysis of these data structures through the design of visualization systems (and interaction) which will allow us to reveal new dynamics of behavior in the city. Around the confluence between the city and data (Data Sensing City) emerges the concept Real-Time City, in which it explicits an evolutionary dimension, auto adaptive, dynamic in the informational systems that constitutes this new model of city, therefore citizens can change their patterns of behavior in relation to these information systems, creating a dynamic reconfiguration of the city.
How will it be, the evolution of cities in the Internet of Cities? Can Real-time City generate new forms of governance, participation, analysis and information management?
Data as a Key to Citizen Empowerment.
The Real-Time City is articulated around the convergence of data structures, sensing technologies, urban computing and mobile technologies. In this model of data city, data is a key to citizen empowerment. Visualization systems are tools that allow us, on one side, visualize data sets with different visualization toolkit (e.g. geo data visualization, mapping or other visualization techniques),and on the other one, these systems are new interfaces, platforms for citizen participation, from which to give voice to non-visible agents in the processes of management, analysis, decision making and production of city. The research proposal of Real-Time City that we propose aims to explore multiple dimensions of data: Sense Data through the deployment of open sensor infrastructure, Open Data as a model and data structure -interoperability, reusable-, Visualize Data, visualization tools for displaying multiple data sets and explore new ways of understanding the data structures, Behaviour Data, performativity data (Responsive Environments), and Data Fabrication, digital fabrication systems that manufacture or materialize data structures.
These tools allow us to collect, visualize and mobilize commons. The design of visualization systems will allow new ways of managing a commons, by designing different levels of participation and interaction.
Art Visualization as a Framework for Generating Emancipatory Territories.
The discipline of data visualization as an emergent hybrid discipline (statistics, programming, cognitive psychology, design) based on forms of representational visualization. These systems must evolve to art visualization in which the visualization is an exploratory device. These systems should not reproduce, instead, they should build connections, as well as the ability to generate new possibilities to reality, mechanisms for the multiplication of subjectivities. These visualization systems reveal unknown patterns, as well as projective of invisible and non-existent environments, so these devices can allow us an understanding of invisible phenomena. The exploration in new forms, codes, languages allow us to imagine new landscapes, ultimately building machines that allow the generation of new emancipatory territories.
Visualization Systems as a Laboratory to Understand how Systems Work.
The growing complexity in urban models, caused by the analysis of data, requires new laboratories, platforms, based on the mechanics of games that allow citizens, through the design of different levels of interaction, to explore the dynamic behavior of cities. These interactions allow citizens to increase their understanding on the functioning of urban systems. These platforms aim to amplify cognitive abilities for a particular information system, and introduce the processes of video gaming to explore new forms of participation and interaction in the city. This implies the concept of a city as a game space, in which new modes of interactivity and participation emerge.
Here are some prototypes which articulate this new field online casino of experimentation in the City :
BCNoids. Enrique Soriano, Marina Rocarols y Pep Tornabell. CODA.

Category: #Visual Data #Real-Time City
“The public bicycle rental service was introduced in Barcelona in May 2007, and its gradual and successful implantation ever since has transformed the cityscape. With their displacements, users of this service generate information about their journeys, bicycles and stations which are then compiled in the central BDM computer. The database generated is later made accessible on the Internet, and it visualises, through specific requests, use patterns and behaviours of this service on an urban scale.”
more information at https://enriquesoriano.net/BCNoids-en-Habitar
–
LIVE Singapore. Senseable City Lab. MIT.
Category: #Living City #Real-Time City
“It provides people with access to a range of useful real-time information about their city by developing an open platform for the collection, elaboration and distribution of real-time data that reflect urban activity. Giving people visual and tangible access to real-time information about their city enables them to take their decisions more in sync with their environment, with what is actually happening around them.”
more information at https://senseable.mit.edu/livesingapore/exhibition.html
–
Open Energy. Fran Castillo. Responsive Environments.

Category: #Internet of Energy #Smart Grid #Open Software #Open Hardware #Real-Time City
“Open Energy aims to develop a platform to explore new systems of visualization and optimization for energy consumption in domestic and urban environments. It explores new ways of realtime visualization power consumption in domestic environments. These visualization structures will allow new ways of relationship between energy and humans. Real-time visualization of power consumption and simulation of future behaviors will constitute a new information system for CO2 levels and real-time value of the electricity. Open Energy is an Open Source prototype. It offers the design of a visualization system which is inserted into a new energy distribution model, where new technologies allow a decentralized production of electricity at a global scale, defining new frameworks for sustainability.”
more information at https://openenergy.francastillo.net/?page_id=6

–
Wifi Camera. Bengt Sjölén and Adam Somlai Fischer, Usman Haque.
Category: #Electromagnetic Data Visualization
“The Wifi Camera is a camera that takes “pictures” of spaces illuminated by wifi in much the same way that a traditional camera takes pictures of spaces illuminated by visible light. The camera reveals the electromagnetic space of our devices and the shadows that we create within such spaces, in particular our wifi networks which are increasingly found in our daily lives. With the camera they can take real time “photos” of wifi. These show how our physical structures are illuminated by this particular electromagnetic phenomenon and they are even able to see the shadows that our bodies cast within such “hertzian” spaces. Radio waves at wifi’s wavelength behave similar to light in that they are reflected off almost all solid objects to varying degrees, just as when we see colors we see the light from a light source being reflected off an object into our eyes. And, just as with light, some materials are opaque and some materials are more or less transparent.”
more information at https://camera.propositions.org.uk/
–
Performative Topologies. DesignedByEnergy.

Category: #Responsive Environments #Evolutionary Architecture
“An evolutionary shape optimisation framework for daylighting performance coupling a particle-spring system with an energy simulation tool”
more information at https://www.designedbyenergy.com/site/?p=202
–
Fran Castillo (@francastillo) is an Architect/ETSAS and Interaction Designer/UPF. He is currently research director at Responsive Environments. Web https://research.francastillo.net/
DYNAMIC VISUALIZATION SYSTEM AS A FRAMEWORK FOR UNDERSTANDING THE COMPLEXITY OF THE CITY
5,9K

4 comments
[…] more on data visualisations and cities Fran Castillo has drawn together many of these ideas in an excellent post at […]
[…] aéreo) o el Ville Vivante (llamadas móviles de Ginebra). El investigador Fran Castillo, en su web Complexitys, repasa algunos proyectos que visualizan datos ciudadanos de esta nueva e inspiradora real time […]
[…] Vivante (chamadas celulares de Genebra). O investigador Fran Castillo, na web do estúdio Complexitys, repassa alguns projetos que visualizam dados cidadãos desta nova e inspiradora real time […]
[…] investigador Fran Castillo, na web do estúdio Complexitys, repassa alguns projetos que visualizam dados cidadãos desta nova e inspiradora real time city. […]